

In traditional markets, exchanges with high volume equate to high liquidity. However, in crypto markets, exchanges with high volume does not necessarily equate to high liquidity. This is because many of the unregulated exchanges engage in wash trading and other manipulative behaviors to inflate their trading volume.
As one of the leading cryptoasset data aggregators, CoinGecko is committed to doing what’s necessary to empower our users with information to help make better informed decisions. We are fully aware that the market demands transparency and CoinGecko is committed to improving this.
To combat fake exchange volume data, we are launching a new rating algorithm called “Trust Score” on our site which will be implemented universally on our Exchange Overview and Coin pages from Monday, 13 May 2019. In short, “Trust Score” is a blended formula that takes into account exchanges’ reported trading volume, web traffic, and order book depth.
A) Normalized Trading Volume by Traffic (SimilarWeb)
While trading volumes can be easily faked by rogue exchanges, they will however find it much more difficult to fake their web traffic statistics which are aggregated by 3rd party services such as SimilarWeb. The idea here is to not rely on a single source of data, but rather multiple sources of data which will serve as a deterrent against cheating.
The normalization of exchange volumes involves several steps, which we will walk you through below:
- We aggregate monthly web traffic statistics from SimilarWeb for all crypto exchanges that we track on CoinGecko. We then divide it by 30 to get average daily traffic.
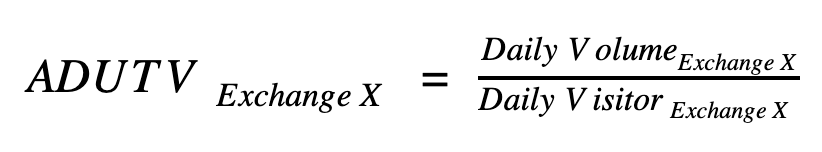
- Together with the daily reported trading volume information that we track, we are able to derive the Average Daily User Trading Volume (ADUTV) for each exchange.
- Then, based on the Bitwise 10 Real Volume Exchanges (Binance, Bitfinex, Kraken, Bitstamp, Coinbase, Bitflyer, Gemini, itBit, Bittrex, Poloniex), we calculate the median for the 10 exchanges ADUTV and we call this the Benchmark Daily User Volume.

- We then derive a Normalized Exchange Total Trading Volume based on this Benchmark. Exchanges with lower ADUTV when compared to the Benchmark will not have their Reported Trading Volume normalized. However, for exchanges reporting ADUTV higher than Benchmark, we will discard their ADUTV and multiply their SimilarWeb daily traffic estimate and multiply it against the Benchmark.
What this means is that exchanges with low visitor count but extremely high trading volume will be penalized and have their volume adjusted downwards.
This methodology assumes that the percentage of users trading on API and mobile app is the same across all exchanges. We are aware that this is a simplification but a required step to better present exchange volume data.
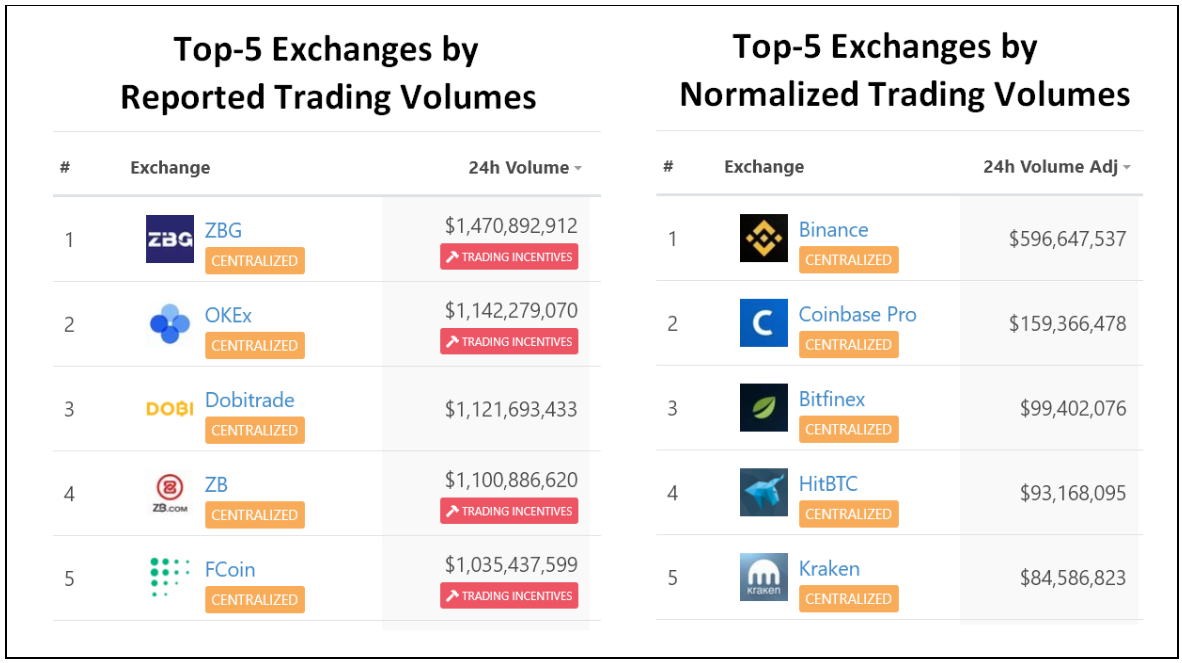
The screenshot above shows how the Exchange Overview page will change between the Reported Trading Volume (left) versus Normalized Trading Volume (right). Exchanges that conduct trans-fee mining and wash trading will immediately be penalized in this normalized trading volume methodology.
Note: At the moment, trading volume normalization happens only for Spot exchanges and not for Futures exchanges.
B) Order Book Analysis (Bid/Ask Spread & ±2% Depth Cost)
We are also introducing two new order book based metrics – (i) Bid/Ask Spread and (ii) ± 2% Depth Cost which, when combined with trading volume data provides a better overview of the real liquidity of any given trading pair on an exchange. The two new order book metrics are defined as follows:
Bid/Ask Spread = (Lowest Ask – Highest Bid) / Lowest Ask x 100
The Bid/Ask Spread is the amount by which the ask price (lowest price a seller is willing to sell) exceeds the bid price (highest price a buyer is willing to buy) for an asset in any particular market. This spread is represented in a percentage format and is a good measure of liquidity. A lower bid/ask spread will mean that a particular market is more liquid while a higher bid/ask spread will mean that it is more illiquid. For more information on Bid/Ask spread, you may read this Investopedia article.
± 2% Depth Cost: Capital in USD required to move the orderbook by 2% up or down from last traded price.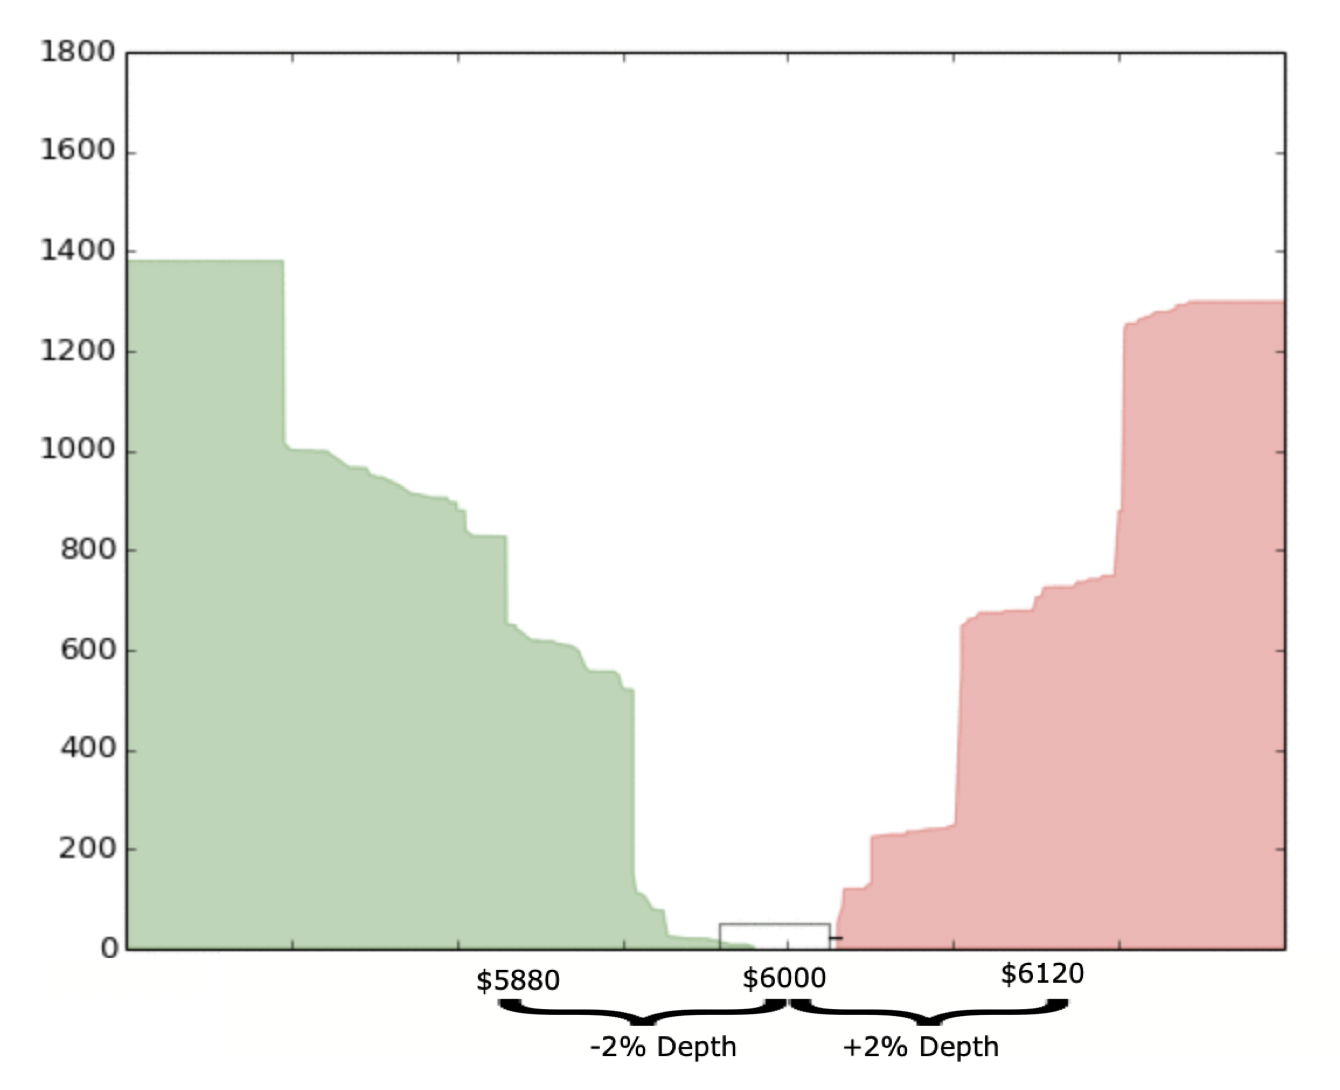
We first take the last done price for any particular market and then calculate the 2% upper and lower bound. Assuming BTC/USDT for a particular exchange was last traded at $6,000, the 2% upper bound is thus $6,120 and the 2% lower bound is thus $5,880.
We then sum up the amount of BTC sitting in the orderbook between $6,000 and $6,120 and then multiply it by the order price. This is the amount of capital required to move the orderbook up by 2% and we call it +2% Depth.
We next sum up the amount of BTC sitting in the orderbook between $5,880 and $6,000 and then also multiply it by the order price. This is the amount of capital required to move the orderbook down by 2% and we call it -2% Depth.
A thick orderbook will indicate that there is more liquidity for any trader to come in and buy or sell a particular cryptoasset without much slippage while a thin orderbook will indicate that there is no liquidity for any trader to trade meaningfully.
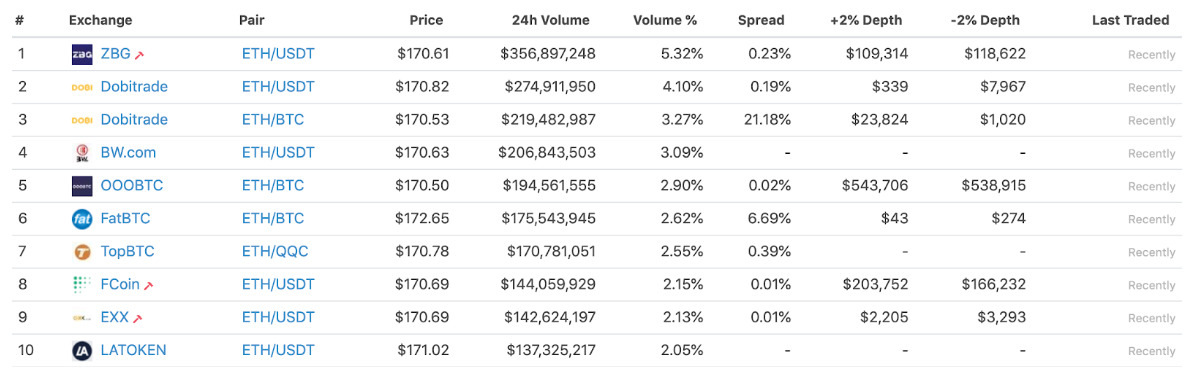
This is how the Ethereum Exchange Trading Page will look like with and without Trust Score.
 Ethereum Exchange Page without “Trust Score”
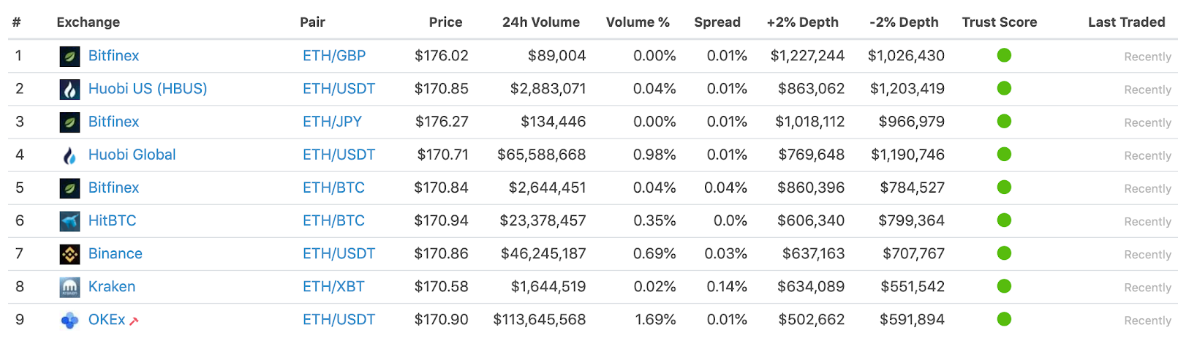 “Trust Score” in action (Ethereum Exchange Page)
With “Trust Score” in action, the list of top exchanges changes dramatically as the algorithm prioritizes exchanges with tight spread and deep depth, rather than purely by volume. This makes trading volume manipulation much less attractive to exchanges, and puts focus back onto what matters to the traders – liquidity.
Our Trust Score algorithm makes it clear that greater volume does not necessarily equate to a healthier orderbook (defined as having tight spread & deep depths). By combining the volume, bid/ask spread and ± 2% Depth Cost metrics, we define a “Trust Score” for each individual trading pair.
The “Trust Score” is bucketed into three categories namely Good, Fair, and Poor. They are reflected using the colors Green (Good), Yellow (Fair), and Red (Poor). With “Trust Score”, users will have a much more holistic overview of liquidity on each exchange’s trading pair.
What will CoinGecko do next?
The current iteration of CoinGecko’s “Trust Score” places a strong emphasis on liquidity metrics. This is Step 1 in our multi-step approach to improving transparency in exchange data. As the first data aggregator to implement exchange data analysis, CoinGecko is setting the tone that any cheating or falsified exchange data will no longer be tolerated.
Moving forward we will be adding more metrics to our “Trust Score” to improve its robustness. Here are some of the data which we will be tracking further in the coming months:
- Trade history analysis
- API quality analysis
- Cybersecurity analysis
- Hot & Cold wallet analysis
- Social Media analysis
- Exchange support turnover time
- User Reviews
- Licensing & Regulations
Closing Thoughts
Through CoinGecko’s introduction of “Trust Score”, we are hoping to put a stop to trading volume abuse and shed more light on exchanges’ real liquidity. Users in the cryptoasset industry deserve to be presented accurate data and CoinGecko as a leading data aggregator has the responsibility to improve transparency in the industry.
As always, we are open to opinions and we would really appreciate your feedback – get in touch with us on Twitter, Telegram, Discord or contact us at support.coingecko.com.
[Update @ September 2019] Trading Pair Liquidity Estimation
Building upon our initial iteration of Trust Score, we have improved it by incorporating the following two metrics to grade the liquidity of each trading pair.
1. Normalized-Reported Volume Ratio (NRR)
CoinGecko measures two different volumes for exchanges at the moment. These are the Reported Volume (as provided by exchanges) and the Normalized Volume (based on SimilarWeb Web Traffic estimates above). NRR is calculated by taking the ratio of Normalized Volume and Reported Volume:
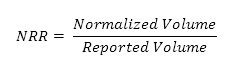
The closer the ratio is to 1, the more likely the trading volume reported by said exchange would be true.
2. Trade Activity
The timestamp at which trades occur for each trading pair is used to determine the level of activity and liquidity associated with each trading pair.
There is a positive correlation between trading volume and trade activity. The lack of such a correlation indicates that an exchange is likely engaging in suspicious activities and should be treated with caution.
By combining both NRR and Trade Activity, our Trading Pair Liquidity Estimation is now more robust and better reflects the liquidity of each trading pair.
32 thoughts on “CoinGecko Introduces “Trust Score” to Combat Fake Exchange Volume Data”
I want to contact some one please
Best regards
You can contact CoinGecko via hello@coingecko.com
Much needed improvement. I like Coingecko much better than Coinmarketcap now!!
Thank you for your kind words! 🙂
Have always felt that coingecko has been developing a broader metric than some of the other coin stat sites that rely on data than can be, and obviously is fudged/inaccurate. Keep it real! : )
We’re always working hard to display more and more data on our site, and it is our hope that it’ll be useful to all our users. Thank you for your support! 🙂
Good…. Hope be a potensials
Thank you for your support! We hope this feature is useful for you 🙂
Another another way we can make millions of dollars
hello -please checking yobit exchange they are scam and all coins are fake and not real they made fake market for stealing moneys from peoples all volume s are fake report this exchange everydays scam peoples
Good project
Правильное направление на лидерство!Слабых быть не должно!
i would like coingecko to provide a pre biggmovers service,advising its users of POTENTIAL BIG MOVERS
Xin hỏi: sct token có phải là mã thông báo của coinspace phát hành không?
I found “Trust Score” very accurate. Good job at CoinGecko!
Now, I’ve begun to like Coingecko much better than Coinmarketcap.
Hi
Your effort very great
Good guide to select coin and exchanger
All we need here
…
Thank you very much
I believe that it s a good concept, but what I keep wondering is how they want to make this happen because the last time I checked, this exchanges are centralized and no one have access to their back end except from them, so this would be a very difficult task since it would be hard to know which volume is real and which is fake, though I would wait and see how they achieve it when they start.
Hello! Could you help me please, because I haven’t got it quite well. As I see from the formula and the list of the Benchmark Exchanges, 9 out of 10 Benchmark Exchanges have NRR=1. From my point of view this is impossible due to the meaning of the Median. So there must be not more then 5 of them. Is it correct or maybe the list of Benchmark Exchanges is different?
Where I can find more detail about API quality analysis CoinGecko? Thank in Advance
It is a very interesting and good concept. I really enjoyed your blog.
CoinGecko, confiança sem falsidades de manipulação de preço, tem muito isto no mercado, Parabéns, principalmente as grandes querendo derrubar os pequenos.(o mercado e pra todos, se não tiver sardinha, também não haverá grandes baleias, então cabe a cada um entender e estudar e correr atrás de seus objetivos.
How Long Should You Be In Deepsleep
https://tinyurl.com/yhhluxxv
Thank you! https://blog2.coingecko.com/trust-score/ – check my blog
Company
Gecko Labs Pte. Ltd.
UEN 201510008G
Website: coingecko.com
Owner Thong Ngo
I am who owns cryptocurrency #1 ranking market I think we need to talk. About cryptocurrency.
coingecko’s trading volume is single count or double count
can’t find answer from https://www.coingecko.com/en/methodology
this is really good post, i like it, thank you for sharing with us
I am who Owns cryptocurrency #1 ranking Market and I am Satoshi Nakamoto creator of blockchain and bitcoin and bitcoin gold bitcoin 2 bitcoin Black B and others. I want to but everything together I need to start a. Team a big team and. Open my. Own digital global bank first of all. And I mean like starting a hole new. Money monetary global digital ERA.
Who what a job but I will warn you that it will be getting al lot of push back but I know. Who I am and I can prove it.
Exchange manipulation and wash trading are well-known aspects that contribute to the industry’s expanding problems. With this change, nerdle rises to the top of my list of websites that I will suggest to all of my friends who are looking for information on the cryptocurrency market.
How do you come up with Incident rating?
In particular, there are exchanges, where Trust Score’s tab section “Public incident” has no info, but “Incident” is 0 or 0.5.
Thanks
Great to be here and Stumble Guys Online too